Orgvue February 2026
This month sees the release of our new Improved Line Chart along with a number of improvements to our Survey Admin application based on your feedback
In addition this month we have changed how you access the Orgvue User Guides
Improved Line Chart
This isn’t a new chart type - it’s the Line Chart you already know, with meaningful improvements under the hood.
• Interactive editing - line charts now support drag-and-drop
• Better PowerPoint exports - charts now export as fully editable objects (not images), making post-export formatting much easier
Survey Admin Updates
Following user feedback we have made a number of improvements to our Survey Admin application this month
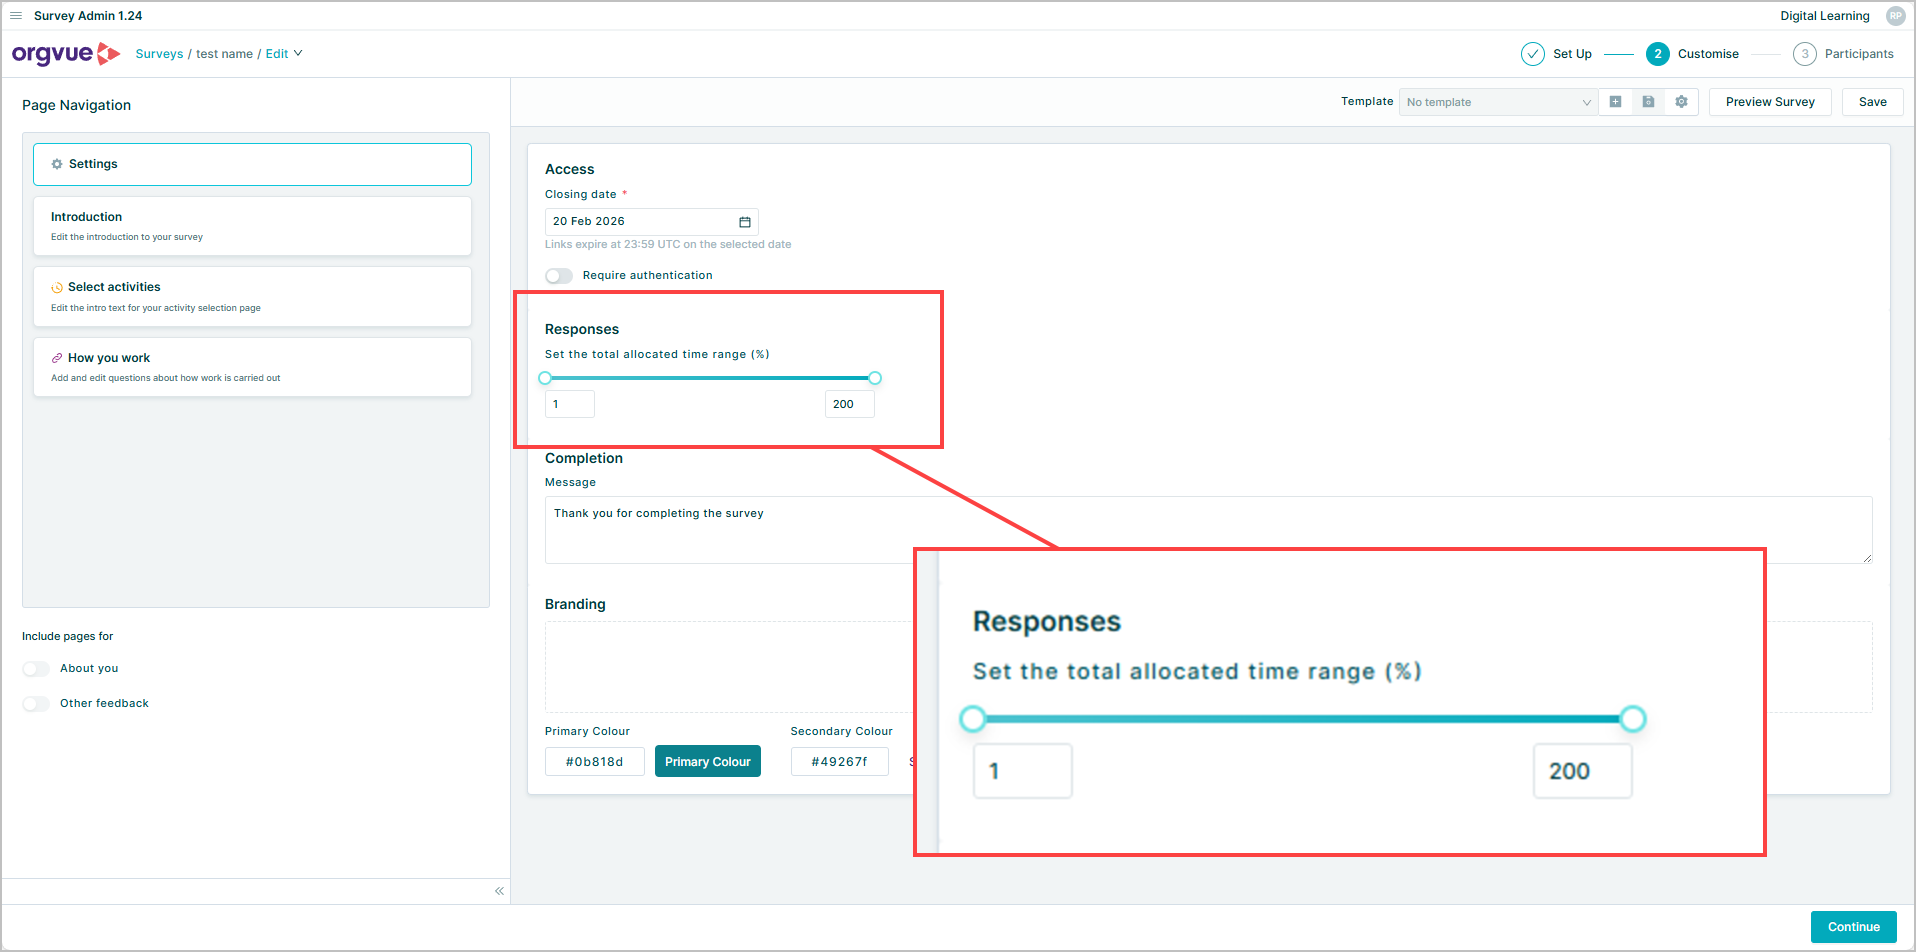
Increased Time Allocation Range
When creating an Activity Survey you can now set the allowable range for total time allocated within the survey to be anywhere between 1% and 200%
This increased range allows the submission of surveys from respondents where the activity taxonomy does not capture all of their actual job activities
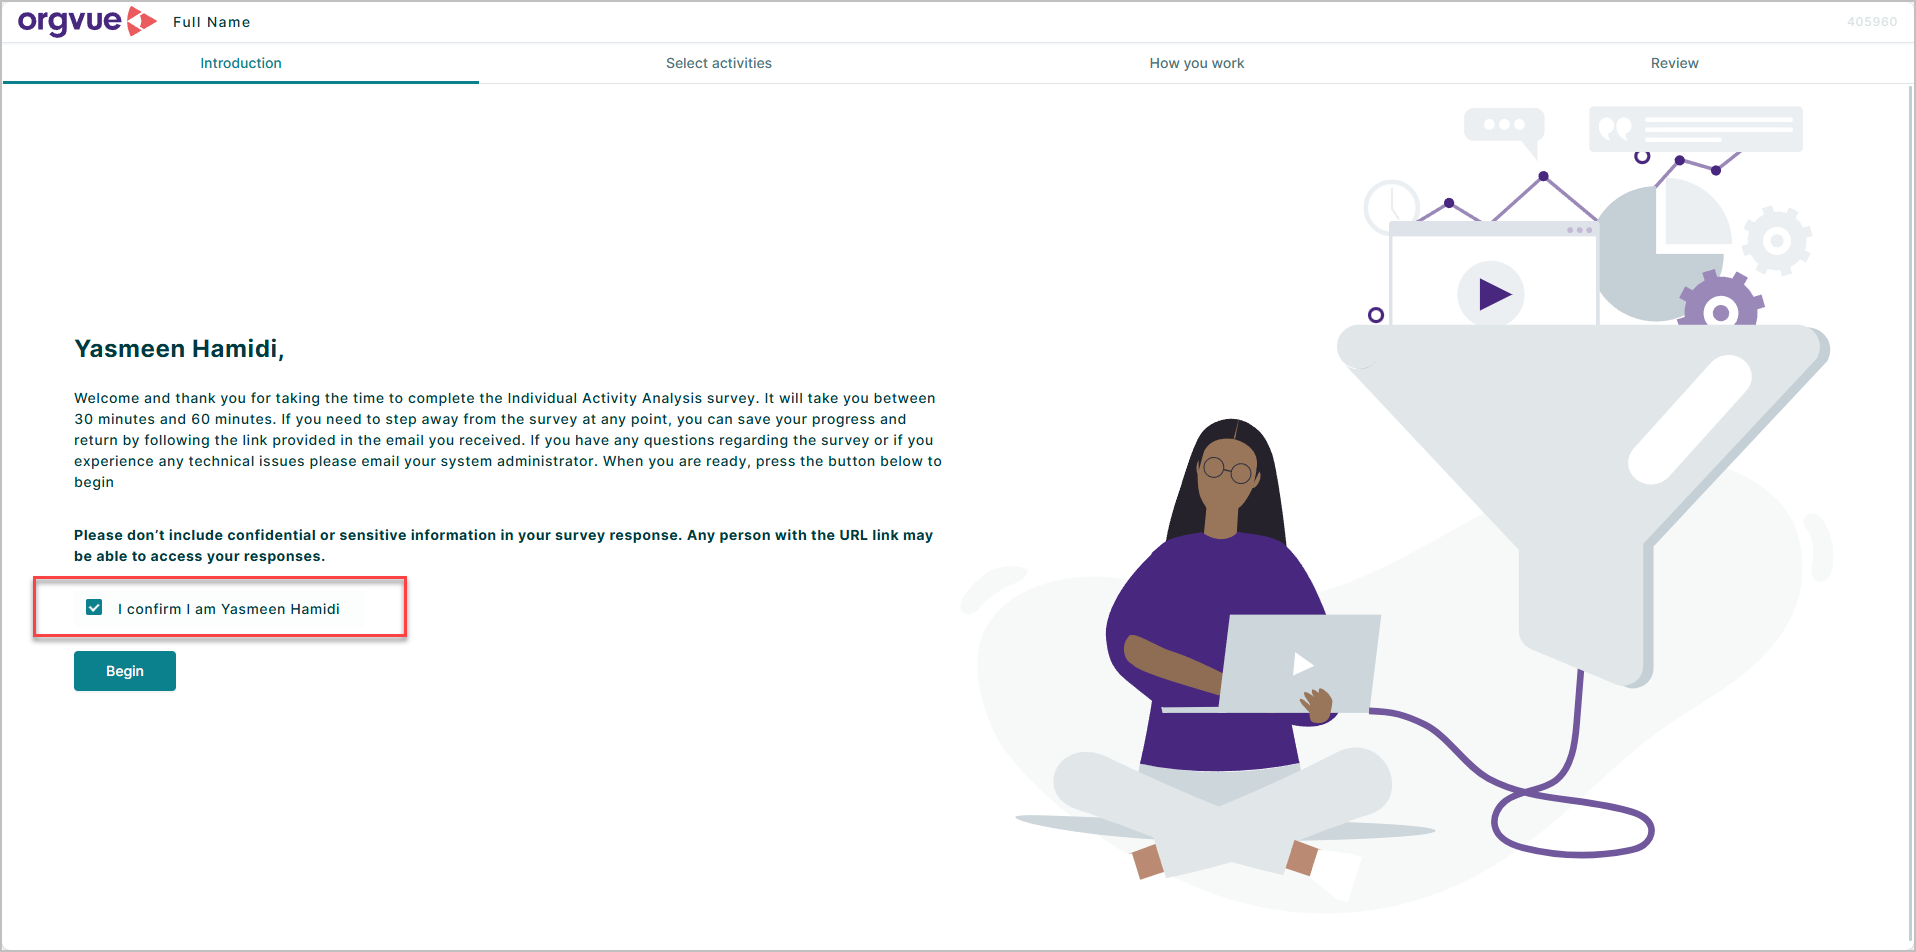
Updated Survey Welcome Page
The welcome screen now shows a participant’s name instead of their email address when Full name is included in the people dataset.
Improved Survey Link Management
You can now view participant access links after emailing them, with a new Download links button on the survey Track page
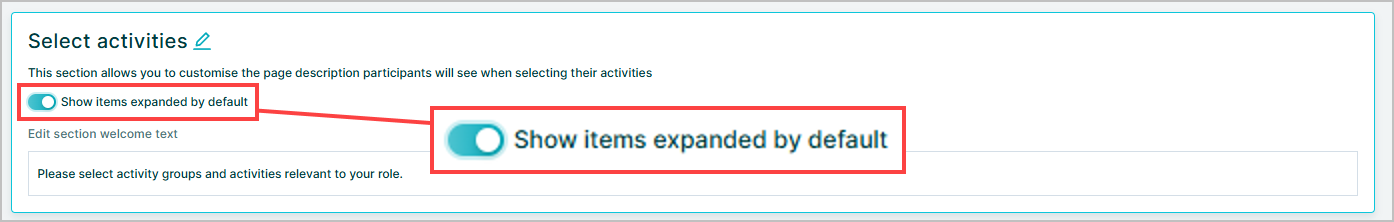
Activity and Competency Lists
You can now set activity and competency lists to start collapsed or expanded when you create a survey, so participants see the layout you intend from the start.
Orgvue user guides have moved
Our user guides are now available only to customers with an Orgvue login. This helps us keep guidance secure, up to date, and relevant to your region and Orgvue environment.
How to access the guides
In any Orgvue application, open the ? menu.
Select User guide index.
Choose the guide you need.
If you open a guide from within Orgvue, you’ll have access automatically. If you open a guide from the links below, you’ll be prompted to sign in to your Orgvue tenant.