Orgvue 3.100
This month's release focuses on adding quality of life improvements to how you use Packs and Workforce Planning as well as making our new Data Dashboard slide available for users upon request
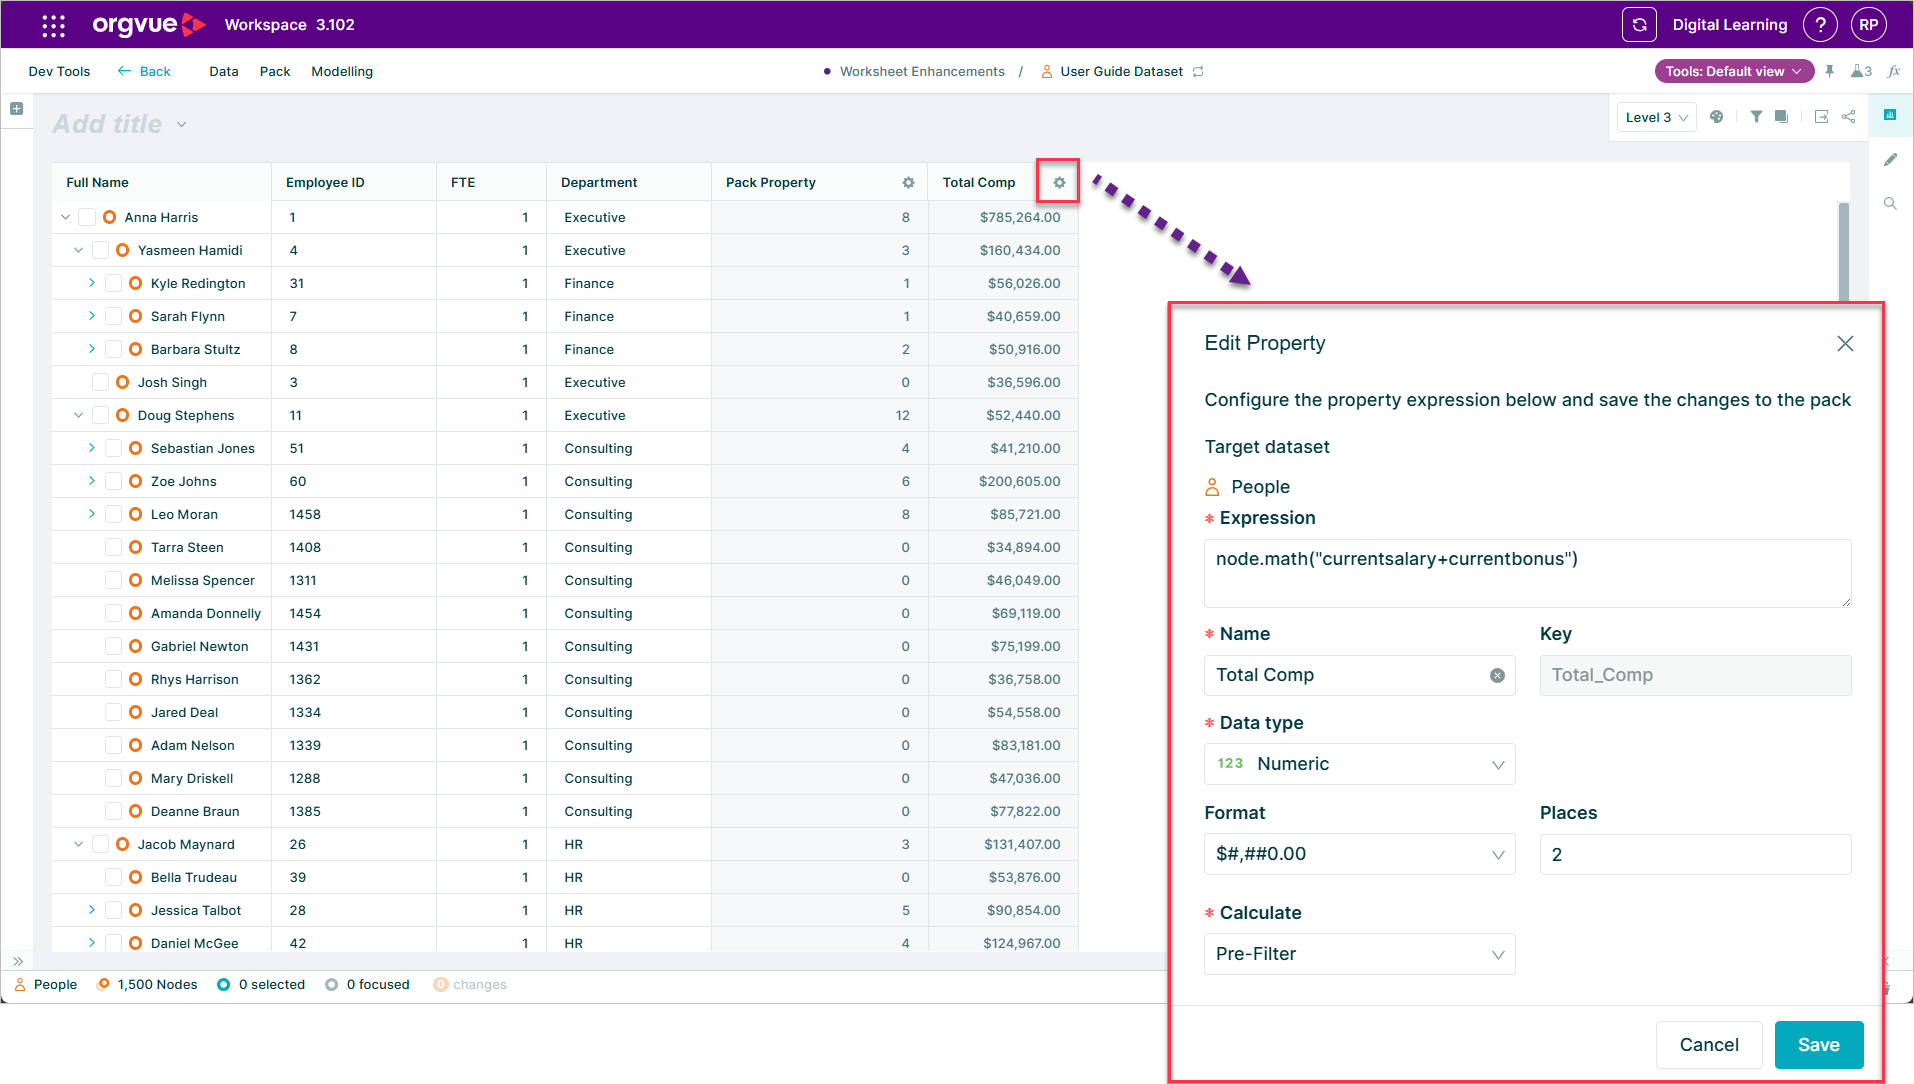
Formatting of Pack Properties
You can now change the format of pack properties to suit your analysis
For example instead of showing 1000 for a monetary amount you can now show £1k when using pack properties.
This now aligns both pack and dataset properties so they provide similar format options
Select between slides and add slide
If you want to add a slide in a specific location you can now click between two slides and select the Add Slide button.
The new slide will be added in the selected position.

Label property in worksheet
When using row groupings on a worksheet the label column will now automatically reflect the display names of the Row properties
Property Types & Patterns Dashboard
Our new dashboard slide, available upon request, can be used with any dataset type and gives you a quick view of the quality and distribution of values within your dataset
You can even use drag and drop within the cards to clean your data values
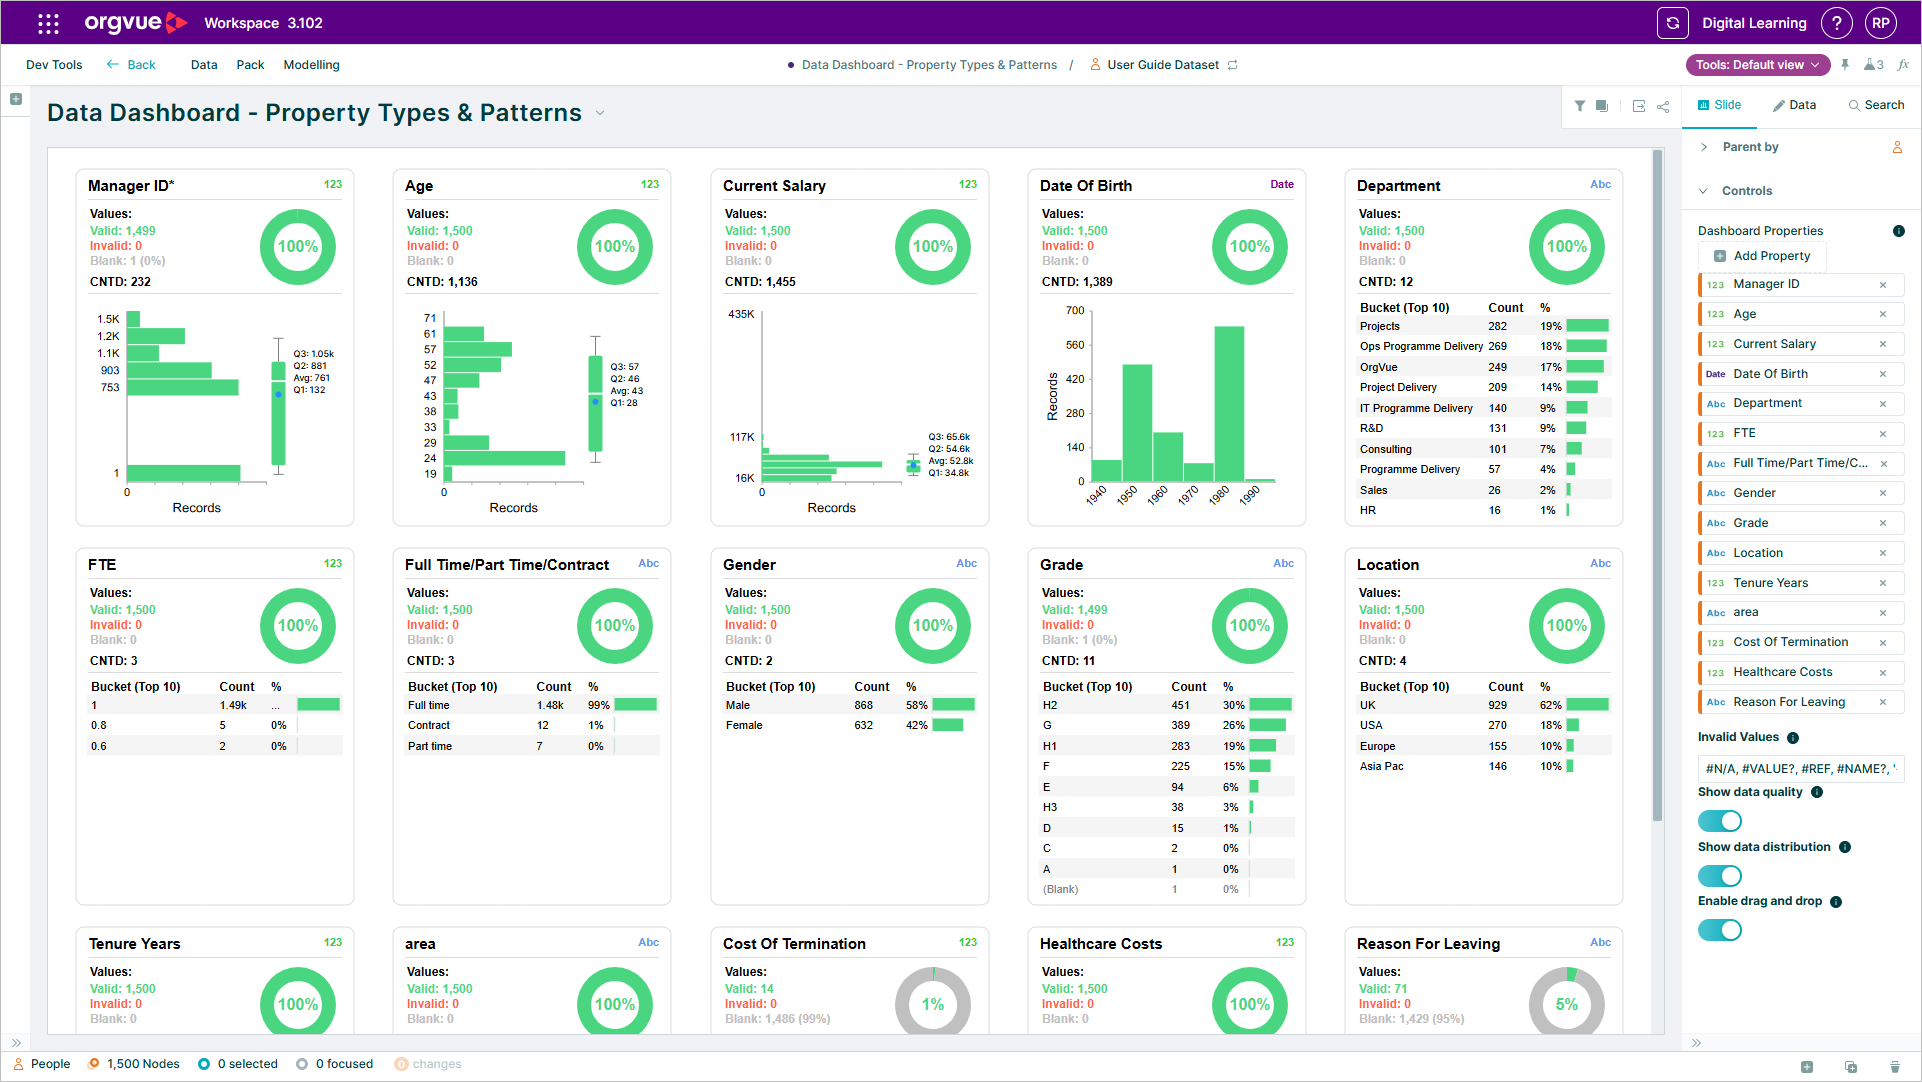
Speak to your Orgvue representative if you would like this dashboard slide added to your tenant
Enhanced demand insights in Workforce Planning
A Detailed Driver Breakdown Table is now available within Demand Planning
The new table view offers a detailed and clear breakdown of future demand projections, categorized by each contributing demand driver, making this data easily accessible for extraction and further analysis.